Key Metrics for Data-Driven Digital Banking
- Reading Time: 9 minutes
Compared to other industries, financial services and banking industry are largely data driven. It’s no secret that banks are now processing big data to make smart business decisions. Increased consumer engagement with digital platforms and the expectation of seamless experiences across all channels, are driving future customer experience design for many industries.
Due to COVID-19, beginning from the first quarter of 2020, banks and credit unions had to quickly provide digital engagement capabilities, from digital account opening to loan applications. The banking sector has undergone a rapid transformation with the growth in data, the necessity of processing the data, better organization and integration, and satisfying digital users with increasing expectations. Before that, users who contacted the physical branch to solve their problems or get services can now get instant, online and personalized answers to their questions. Thus, through data analytics banks have seized the opportunity to learn from digital behavior of their users and embrace the benefits of data-driven technologies. Big data analytics in the banking market is expected to record a CAGR of 22.97% in 2021-2026.
How analytics platforms help players in digital banking?
Data analytics platforms help financial industries better understand behavioral data and turn that data into action with meaningful insights. These tools enable banks to better understand their customers, thereby increase revenue. They also offer flexible solutions to banks that find it difficult to turn great strategic insights into daily targets.
Analytics tools help ensure a seamless end-to-end experience by making sense of customer behaviors and identifying pain points in their journeys. Thus, they enable real-time customer segmentation and delivery of personalized experiences in line with expectations, which has become almost a necessity for banking in recent years.
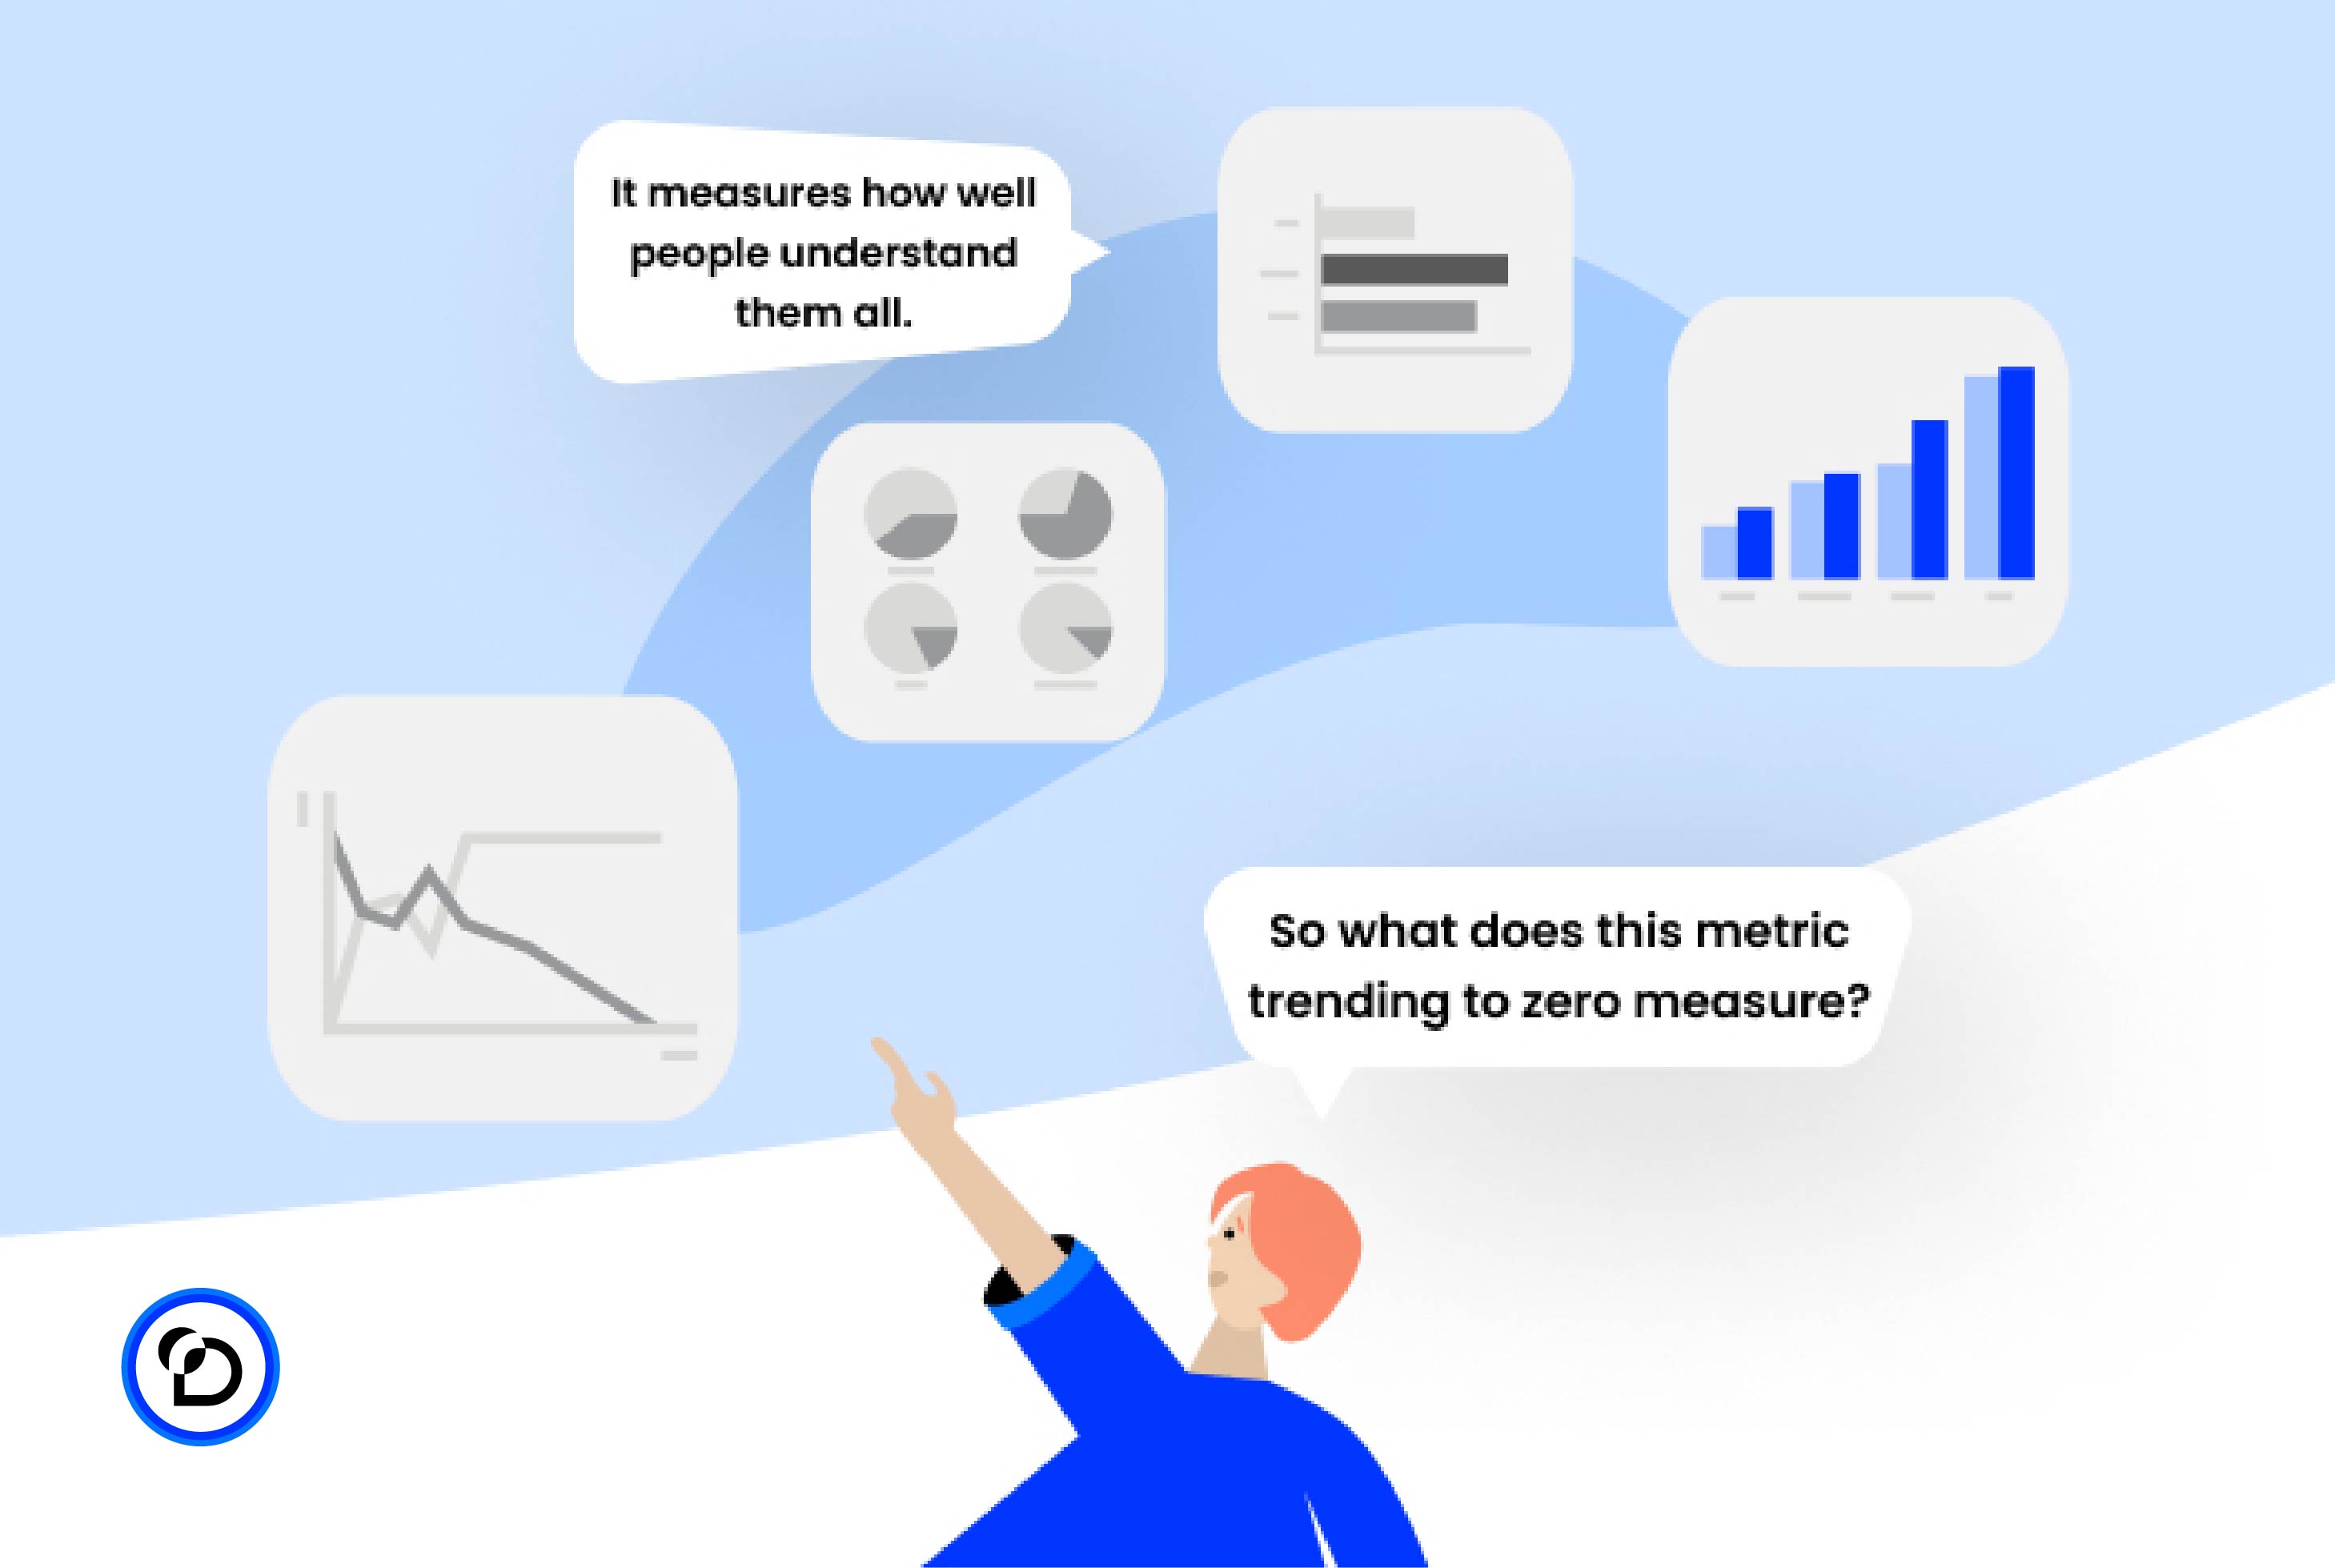
Featured key analytics metrics banks should track
Banks need to track certain metrics to evaluate analytical features accurately and make improvements by measuring all kinds of transactions and services.
In our previous article, we grouped metrics under the categories of user acquisition, user engagement, user retention, user engagement, user removals, and user dropouts. Let’s recall briefly these metrics with a focus on the banking industry:
Events metric
With analytics collecting and analyzing real-time insights from customer events, banks can create unique experiences for their customers’ financial activities. All actions can be gathered under events metric, including how users discover the app, how they navigate the channel, and how many times they click where.
For example, a bank customer uses his/her debit card to purchase a product. At the same time, he/she receives an instant notification about his/her transaction. In fact, the customer’s transactions are carefully examined on the back and long-term customer loyalty can be achieved with instant messages or suggestions that will connect customers to the channel, depending on the type of transaction.
Installs and First Opens
Installs and first opens are other critical metrics monitored to understand how successful a banking app is by showing when and how users are acquired and how they behave after they open the app for the first time.
In addition, how long they stay there and how they evaluate this process are analyzed. In this way, it’s understood how users interact with the app after downloading it.
Session Tracking
Monitoring session data is the way to comprehend how users are using the banking app and moving up the user funnel. Sessions are displayed based on device, location and time after installation, so you can track how, when and from where your users navigate.
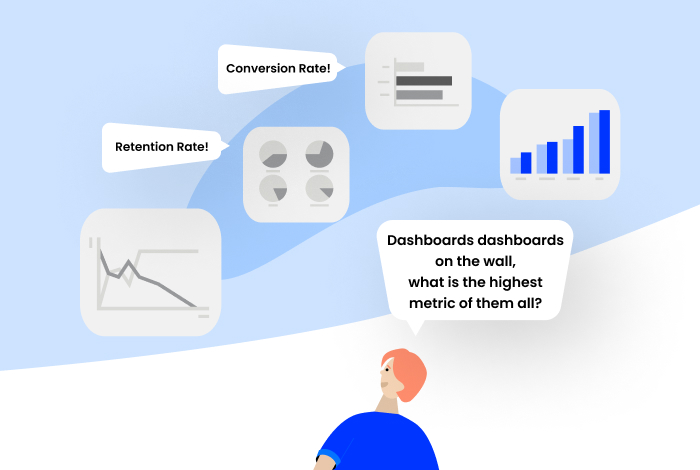
Conversion Rate
Conversion rate is the percentage of visitors who complete a specific goal on an app or website. This rate is calculated by dividing the number of users who completed the goals by the total number of visitors. Conversion rate lets you know exactly how well your products are performing when analyzing sessions. This metric is crucial to understand the motivations of visitors who complete an action in the banking app or website. Thus, user experience can be improved accordingly.
Retention rate
Retention rate is the percentage that companies retain their customers over the period from the time they acquire them. Users who find an app or website useful and valuable continue to use these services. A high retention rate indicates that companies have low loss rates. Evaluation of this critical metric differs according to the services and products offered.
In addition, in the digitalized banking world, meeting customers’ expectations and providing a smooth experience are the key strategies for customer retention. For this reason, banks have taken care to increase their retention rates by being more customer-oriented in recent years.
Daily Active Users (DAU) & Monthly Active Users (MAU)
Daily active users (DAU) and monthly active users (MAU) ratios measure how often customers interact with the product. DAU is the number of unique users interacting with the product in a day. MAU is the number of unique users who interacted with the product within 30 days. These measurements are based on the number of people, not the number of sessions. Therefore, even if the same user interacts with the product more than once a day, only one DAU is accepted.
DAU and MAU are evaluated differently in sectors according to transaction type, campaign periods or seasons. For example, in banking apps, currency exchanges are carried out daily, while transactions such as bill payments are usually performed monthly. In travel apps, the daily and monthly transaction frequency differs based on season and off-season periods. Another factor that will affect the change of MAU and DAU is the campaign periods such as Black Fridays, Cyber Mondays and holiday seasons.
The DAU/MAU ratio is considered another metric used in addition to these. This ratio helps to understand how sticky customers are to the product and the frequency of interaction.
Average Session Length & Frequency
Average session length is a metric that reports the average time customers spend on a mobile app or website. Average session frequency shows how often each user visits the product. These two metrics allow us to evaluate the familiarity level of customers returning to the app and the percentage of new customers.
While measuring these metrics, the time spent both in any tab of the product and in the whole experience of product is considered separately. Although these two metrics seem to be separate, they are used for supporting the data to make sense of how much time users spend on the product. While the measurement for these metrics varies by service and product, according to research, a reasonable time for an average session is between 2-3 minutes.
Average Revenue per User (ARPU)
If a company is making big monthly profits, this may seem very impressive at first glance. But if this gain is based on a very high number of users, it cannot be said to be so. ARPU is a profitability indicator based on total revenue divided by the total number of users. ARPU allows banks to understand how they compare to their competitors. Banks can segment their customers demographically and evaluate ARPU accordingly. Thus, they have a chance to see from which region they generate more income and to seize opportunities.
Average Order Value (AOV)
Average order value (AOV) metric tracks the average amount of money customers spend when they place an order from the website or app. AOV is calculated as the ratio of total revenue to the number of orders.
AOV allows banks to set specific pricing strategies. It also helps to monitor how many of the set targets have been achieved. Thus, the long-term value of customers for the bank can be measured. Increasing AOV is one of the important ways to increase profits directly.
Cost- per-Acquisition
Cost-per-acquisition (CPA) is a metric that measures the total cost of users taking actions that lead to conversion. This conversion may involve many processes such as registering in the system, filling out a form, applying for a loan, opening an account etc.
For example, an advertising campaign was run for a week to a customer group in a certain segment for the loan offer. In this case, the ratio of total advertising cost to total revenue achieved will give the CPA.
Cohort Analysis
Cohort analysis is a method of tracking the common characteristics of users groups using a common feature over a period. This method can be very useful in creating new ways to retain customers. For example, users who signed up for the application in December due to the advertising campaign or who transfer the same amount of money every day can be grouped.
There are 2 types of cohort analysis: Acquisition cohorts and behavioral cohorts. Acquisition cohort categorizes users based on when they signed up or invested in a stock product. This user acquisition period can be followed on a daily, weekly or monthly basis. This metric can be used in a banking app, for example, to track groups of users who invest monthly. Behavioral cohort, on the other hand, categorizes users according to their activity in the app over a certain period. An example is the grouping of banking customers paying bills on a given day. The time set here will vary according to the grouping target.
Crash Analytics
Crash Analytics is a metric that helps identify the cause of a product-related issue (device, operating system, etc.) and minimizes its negative impact, providing real-time updates about it. No matter how good a product or service has a technical infrastructure, errors may occur. This metric is used for detailed analysis of crashes in the app or website. These crashes can be presented to analytics users as detailed crash logs or reports.
If the banking product cannot provide detailed and accurate information on what caused the crashes, it may be necessary to pay this price with extremely high loss rates. It is quite possible that banking and stock market crashes that are waiting for a quick response or complaints from customers can be prevented with crash analytics.
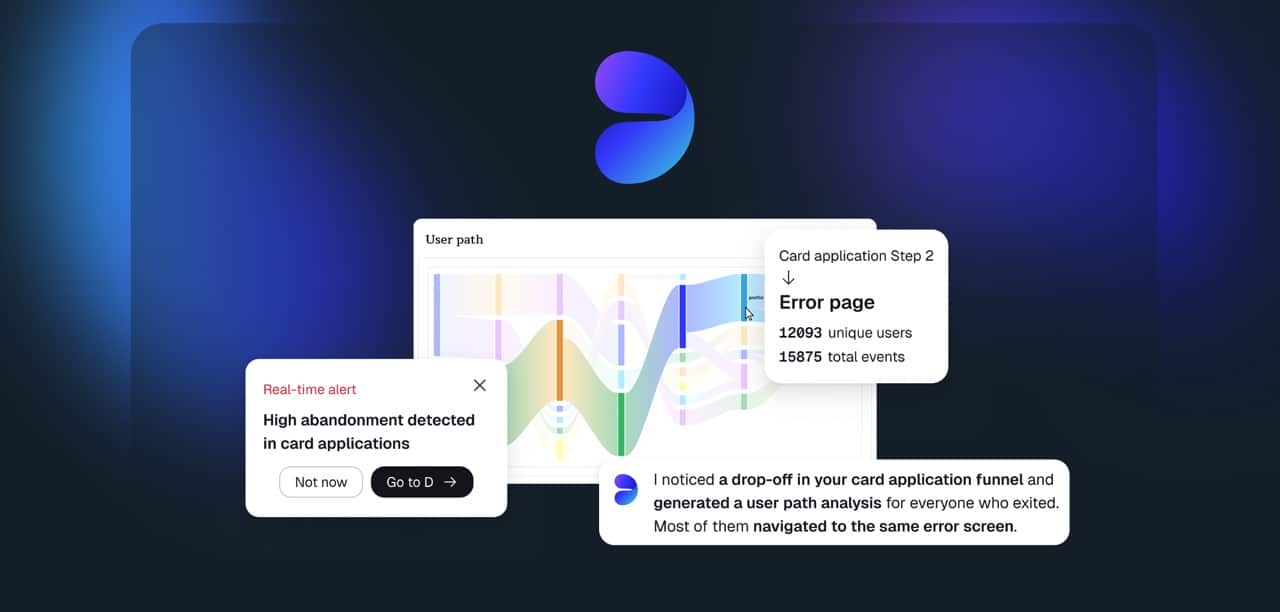
Funnel Tracking
Funnel tracking is a method that involves analyzing and mapping the number of users and customer journey steps on a mobile app or website, starting with user engagement, and reaching an outcome. Steps for improvement are highlighted, showing how many visitors successfully completed the task at each step. Thus, it helps increase revenue by discovering the key drivers of conversion.
This metric, which shows the stages users go through, works with the functionality concept of a real funnel in a top-down narrowing method. Initially, many users interact with the product, but a smaller and smaller number of users perform targeted actions.
Goal Completion Rate
The goal completion metric is used to measure the number of actions users complete as a result of a displayed campaign or offer presented in each date range. Each completed goal, such as making a request for a new product of the bank or applying for a loan, not only measures the success of the product or service, but also shows what customers expect from the product in the end.
The ratio of the number of users who completed a goal to the total number of users gives the goal completion rate. For a goal to be considered complete, a customer must complete all the steps related to the goal.
Key Takeaways
Analytics platforms help banks and all other industries measure and analyse big data. But optimizing the experience can become complex when you do not have a complete understanding of which metrics could be more helpful to track.
Compared to other industries, banks are largely data driven. Data analytics platforms such as Dataroid provide a service for organizations such as banks, which require measurement and analysis of huge amounts of data, to improve their performance and achieve the strategic flexibility required in our days.
It is essential for banks and financial service companies today to create a loyal customer base by acquiring users and more importantly, by retaining digital customers whose expectations grow day by day.
Afterwards, the determination of the most significant metrics and their continuous monitoring will turn into a win-win game for both customers and the key players in this industry at the end of the day.
Sign up to drive your business with the power of data
YOU MAY ALSO LIKE


Drive your digital growth
Schedule a demo today to learn more on how we can help you unleash the potential of digital using Dataroid.