How to Use Cohort Analysis to Evaluate Customer Loyalty
- Reading Time: 6 minutes
There are several user retention tactics that may be used to accomplish this. One of the most important things to do to decrease churn is to identify the issue. Certain data analytics approaches, such as cohort analysis, can be useful.
To increase user retention, you must first determine what motivates current customers to stay.
Businesses may now build new strategies to keep end-users thanks to exponential increases in processing power, better analytics, and advances in behavioral science.
A cohort is really a group of users who have a common trait during a specific time period. Cohort deals with the study of these users’ common characteristics across time. For example, users who signed up for an e-commerce app and made a purchase within the past week, or gamers on a particular platform, can create cohorts.
You can collect user input and track comparable activities taken by a collective sample group by segmenting your sample existing customers into groups with shared qualities or activities like this, then begin to integrate behavioral traits.
These patterns will be used by companies that offer digital products and services to make educated judgments about how to increase income and user retention rates post-download.
How to increase retention & know when you lose your customer.
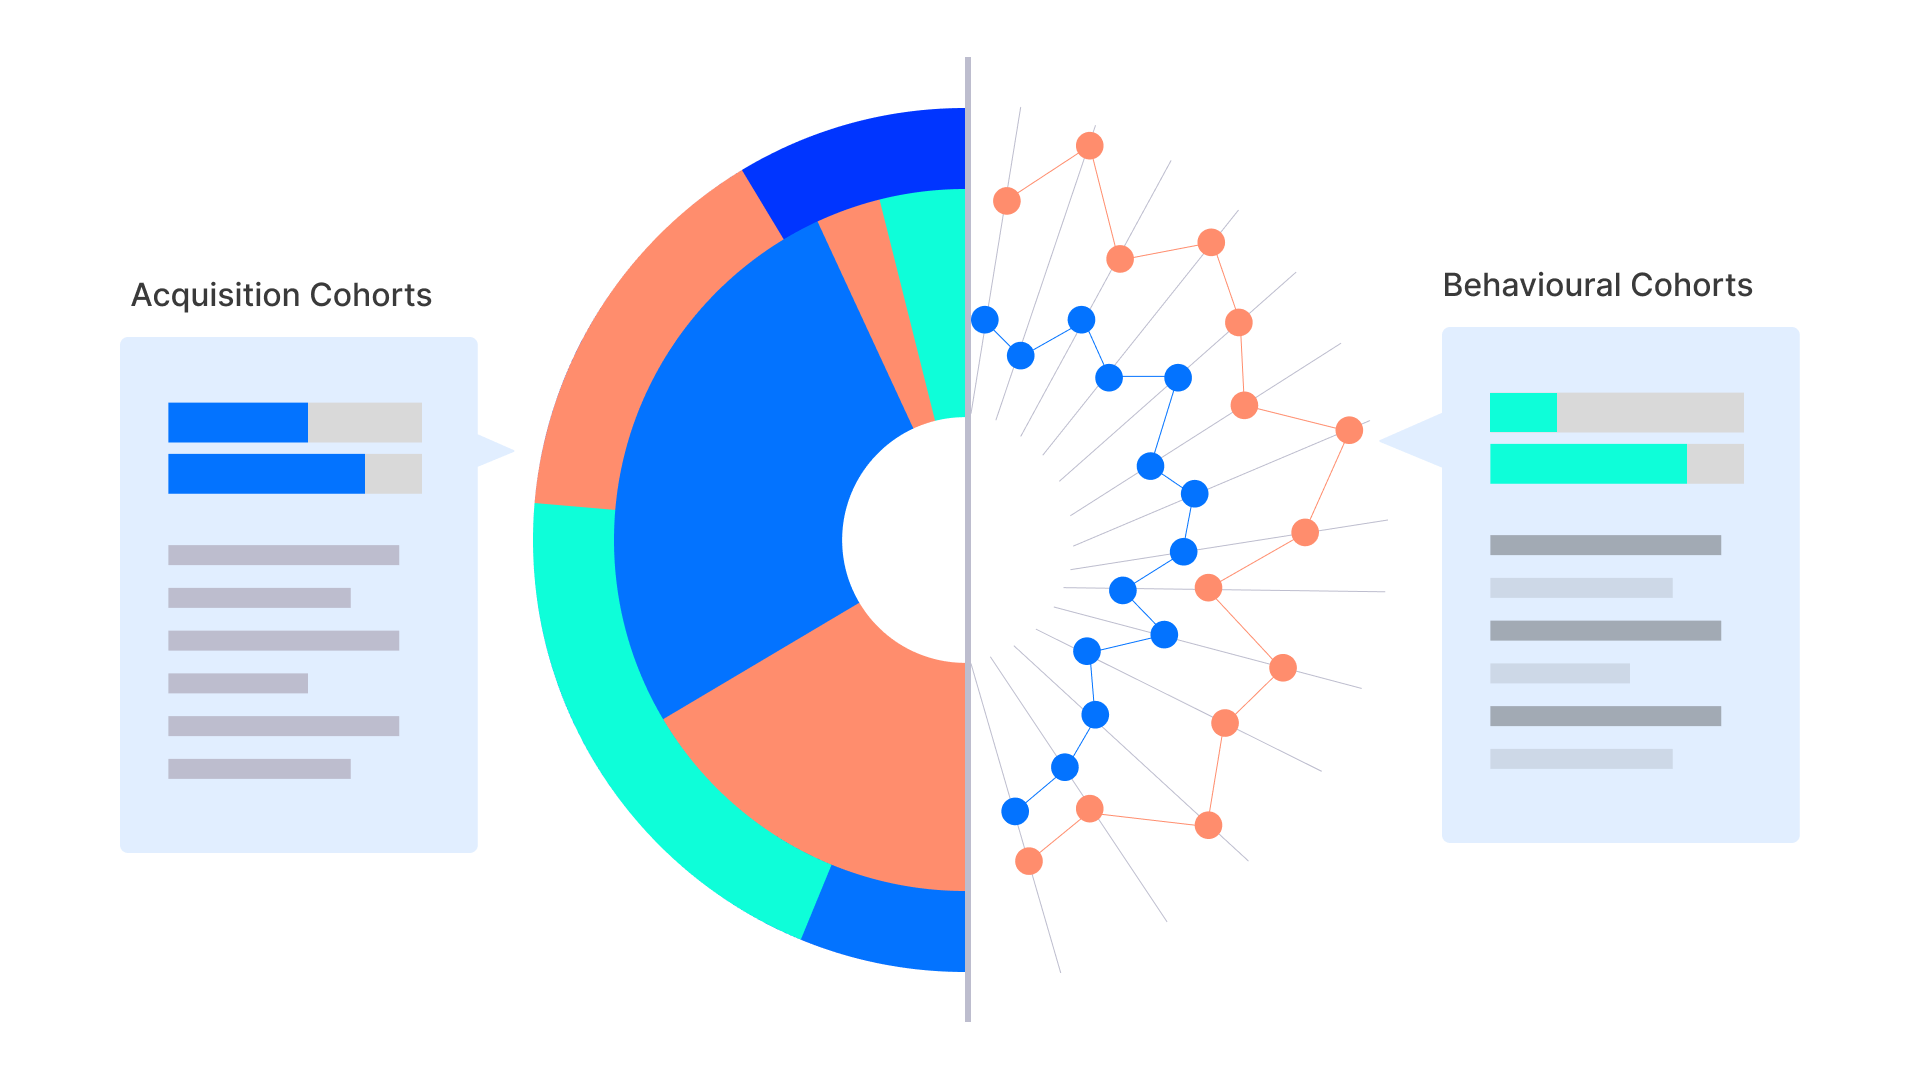
Cohort analysis is classified into two types:
Acquisition Cohorts
This cohort categorizes users depending on when they were acquired or subscribed to a product. User acquisition might be measured daily, weekly, or monthly, depending on your offering. In the acquisition cohort, you can clearly see at what point users are reattaching with your digital product and when exactly you should take action to stick them around the product.
A users mobile app for productivity, for example, can monitor its acquisition cohorts on a frequent basis. A B2B app with a specific user group, on the other hand, would prioritize monthly acquisition.
Behavioral Cohorts
Divide people by the actions they took (or did not perform) in your app within a certain time period. These might be any number of distinct activities a user can do — App Launch, App Install, App Uninstall, Charged or Transaction, or any combination of these actions / events. Characteristic traits (such as their devicetype/brand, customer segment, gender) can also be used to create a behavioral cohort.
Your cohorts could look like this:
• Users registering trials in the last 30 days
• Paying Android mobile shoppers in May,
• Players attracted through social media advertisements
• Users in corporate segment
In this scenario, a cohort may be defined as a set of users who performed specific behaviors during a particular window, such as the first three days of app use. You can then track how long certain cohorts remain engaged in your app after doing specific activities.
Sign up to drive your business with the power of data
Metrics to Consider When Using a Cohort Analysis to Improve Customer Retention
When it comes to analyzing user retention, there is just too much data. Cohort analysis assists in focusing attention on a few key parameters. Some examples of such measures are:
Occurrence Rate: Best for user retention performance. The repeat rate is the proportion of users that transact with your company on several occasions as opposed to cohorts who only make one transaction.
- First Occurrence Rate: The first occurrence is how much time users are taking to perform the return event. This rate is the percentage of users, who perform the return event for the first time (after the first event) on a specific day and the percentage of users, who did not perform the return event until the selected day.
- Last Occurrence Rate: The last occurrence shows the latest day a user performs the return event. The last occurrence rate is the percentage of users, who doesn’t perform the return event for a long time and the percentage of users, who did not perform the return event since the selected day.
- Average Occurrence: Shows how the average occurrence of returning behavior per customer is changing over a fixed period of time.
Some other commerce metrics:
Orders Per Customer: The orders per customer measure is closely related to the repeat rate. Customers who place more orders suggest a high retention rate.
Average Order Value (AOV): The AOV measure aids in the identification of high-value groups that may be targeted particularly with marketing initiatives. It aids in avoiding wasting time on cohorts with poor AOV.
Time Between Orders: The time between subsequent orders is a difficult quantity to quantify. Depending on the products/services offered by your company, the time period might be measured in hours or months. This measure may be utilized to generate reactivation emails that will increase the repeat rate.
How Cohort Analysis Can Assist Product Teams
Cohort analysis assists product teams in segmenting customers based on first onboarding or user flow. As a product manager, this would assist you in understanding how users adopt and use your product to fulfil the goals for which they acquired it.
While developing a product, the product design and engineering teams may have a specific process in mind. Cohort analysis allows these teams to assess their own performance.
It helps them to comprehend how users move through this workflow and inquire as to what prevents them from making judgments inside a certain time frame.
The following questions can be answered with Cohort:
- How many days after users like the product do they buy it?
- In how many days do those who add the product to their cart buy it?
- In how many days do those who download the application log in?
- At what rate does it take place for those who have logged in to the channel again?
- How many days after starting a flight search is a successful purchase made?
- What % of viewers of Campaign A have not been on the channel for X days?
- After how many days does it take for viewers of Campaign A to reach the next channel?
- Do laptop users tend to repeat their purchases or mobile users?
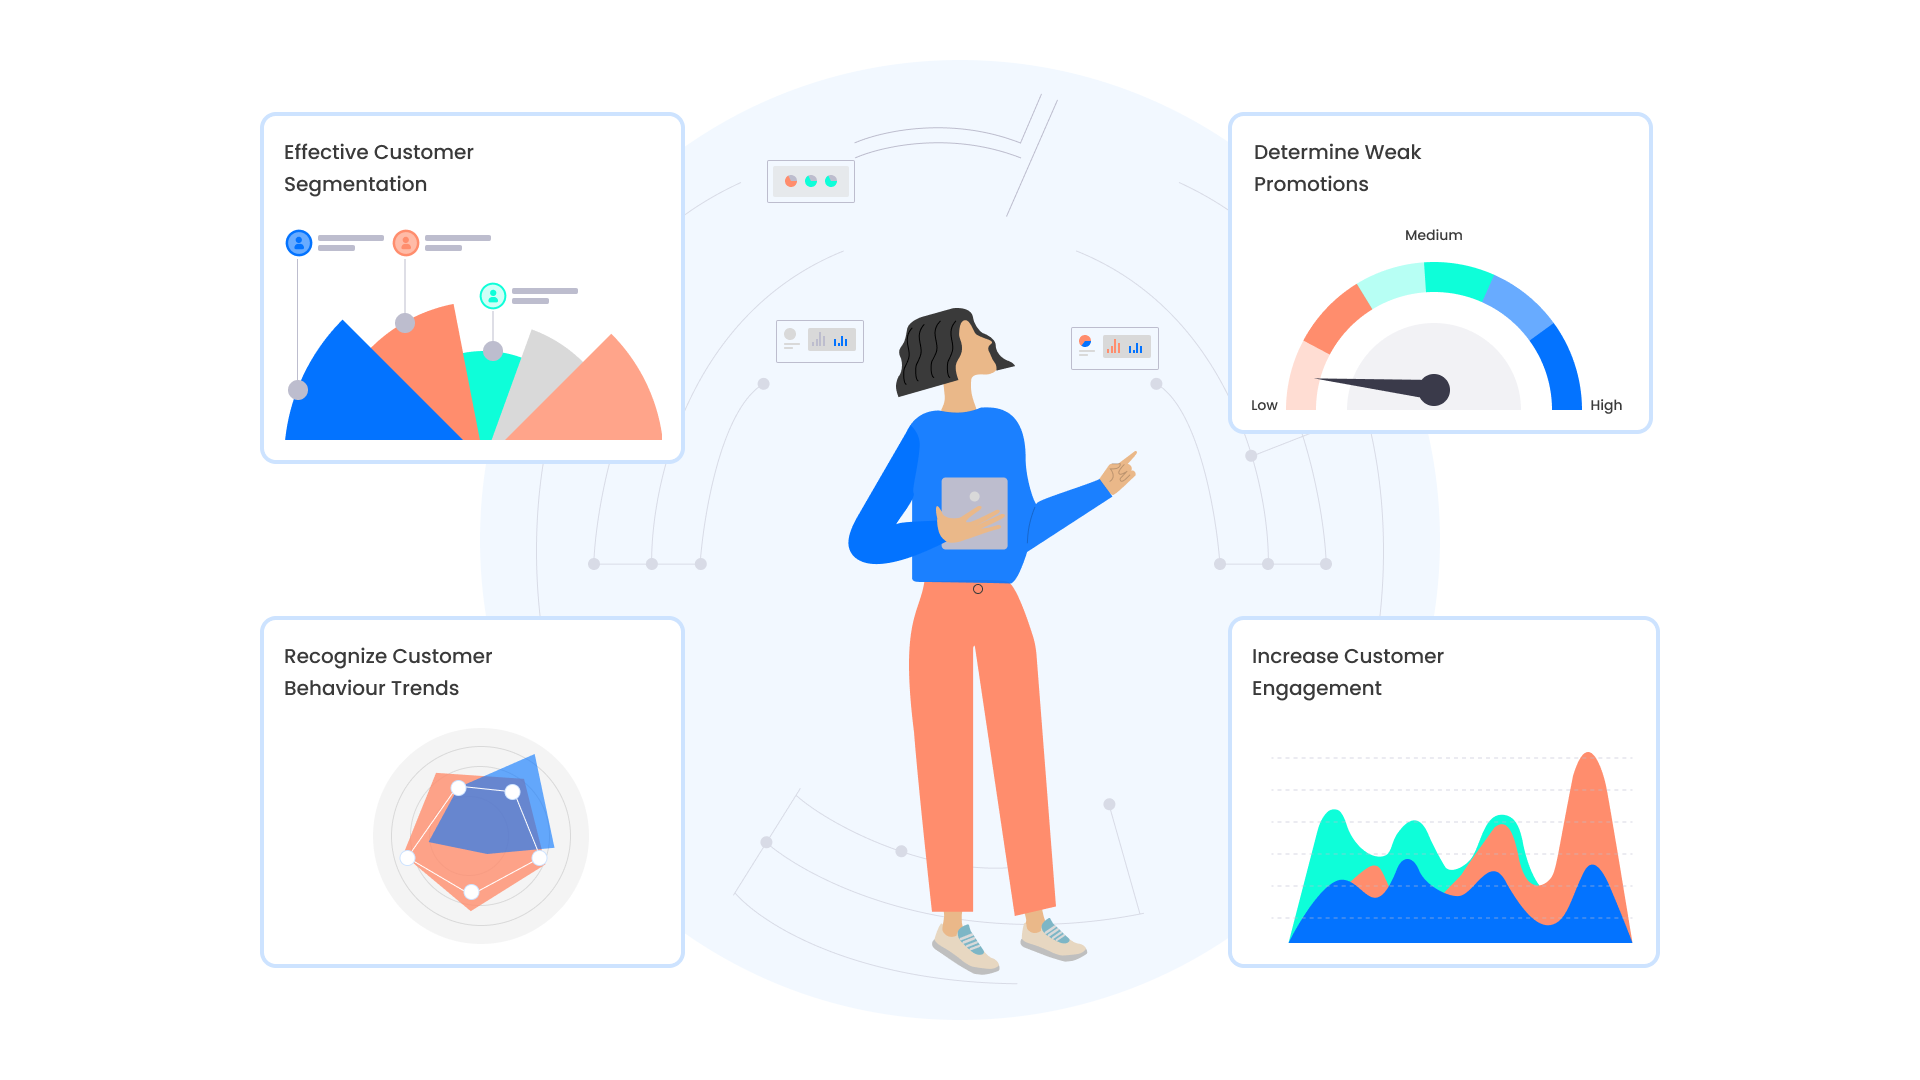
5 Benefits for Using an Integrated Cohort Analysis Tool
- Recognize Customer Behavior Trends
- Do Effective Customer Segmentation
- Determine Weak Promotions
- Increase Customer Engagement
- Improve Onboarding Process
Key Takeaways
Now that you understand how cohort analysis, classified as behavioral and acqusition, works and why it is useful, think about finding the correct tools for the job. Dataroid provides the most powerful data analysis tools available, allowing you to easily examine data spanning acquisition, activation, loyalty, and recommendation metrics.
You can gain direct insight into how your customers interact with your brand by gathering repeat business, average yearly revenue, total lifetime earnings, and renewal rate cohort data all in one place. The end result is a simpler, clearer decision-making procedure for resolving issues, identifying opportunities, and increasing user loyalty.
Sign up to drive your business with the power of data
YOU MAY ALSO LIKE


Drive your digital growth
Schedule a demo today to learn more on how we can help you unleash the potential of digital using Dataroid.