The Designer's Tool Belt & Product Analytics
- Reading Time: 6 minutes

Senior Product Designer
Where to begin?
No man is an island
As designers, we need to acknowledge that analytics is not our territory. However, we need to reach a certain point where we can communicate and at least talk the same language with business analysts. In this way, we can constantly learn from them, just as we’re trying to be on the same page as engineers and product owners through design systems.
Having said that, design is a multidisciplinary activity that crosses many disciplines; from psychology to ergonomics, art, and the list goes on. So, why not analytics? That is to say, designers work across boundaries and collaborate with cross-disciplinary teams on a daily basis. It’s our superpower to adopt and collaborate while leaving room for a vision. Maybe that’s why design is the fastest-growing discipline in the tech industry.
What is product analytics?
From the designers’ point of view
Product analytics supports the creation of a user-centered product by guiding the process through metrics that reveal what works for users and what does not.
Before moving on further, let’s start with the basics of analytics terminology. I often run into designers who use data and metrics interchangeably. However, while your data point may be just a number, a metric is the number of minutes or hours. So the metric is a quantitative measurement of data.
Product analytics is the logical analysis of metrics that are acquired from your product. It’s a way to understand the raw reality of how people use the product. In order to see how users interact with the product we need to use something called ‘‘event’’ or “event chains”. Event is any user activity to be tracked. From this perspective, it is actually Defining event = Defining the question we are wondering.
For instance, let’s imagine a dashboard page. What do users actually use the dashboard for? Which chart do they interact the most? Do they export these charts or share its link? What is the most used filter and how do they navigate through this specific page?
As a designer, once you have that information you might use that information to prioritize changes and evaluate certain UI elements’ visual weight, or UX writing of your labels. The idea is to use analytics as another tool in our toolbelt.
The more you get comfortable with data the more you will be able to include in your design process. Using RFM segmentation analysis for enriching the content of UX personas could be a good example of this. RFM segmentation is an useful method to identify the most important types of customers grouped by scores based on their recency, frequency, and monetary values.
- Persona X is interested mainly in product A but also buys product B
- Persona Y visits these pages 2 times in a specific time period
Basically, at any stage of product design, data can support designers’ decision-making and help them to find solutions to problems.
In the end, design is about making intentional decisions, and if they are properly selected, metrics can be valuable input to guide those decisions. Selection is an extremely critical step because it is almost impossible to monitor, collect and analyze every metric.
From this point, getting familiar with types of product management frameworks and methodologies is a good way to start. Every company has a different method of product management that suits its needs and requirements.
Nevertheless, this soft skill of getting familiar with the frameworks might not only help you to understand your product and environment better but also support you in contributing to the product’s roadmap through your ideas and questions.
Sign up to drive your business with the power of data
Frameworks
What are we tackling first?
Initially, it frames the context of a problem. Frameworks are essentially a structure for breaking data into meaningful pieces and grouping them according to your prioritizations. Briefly, frameworks prevent us from drowning in data.
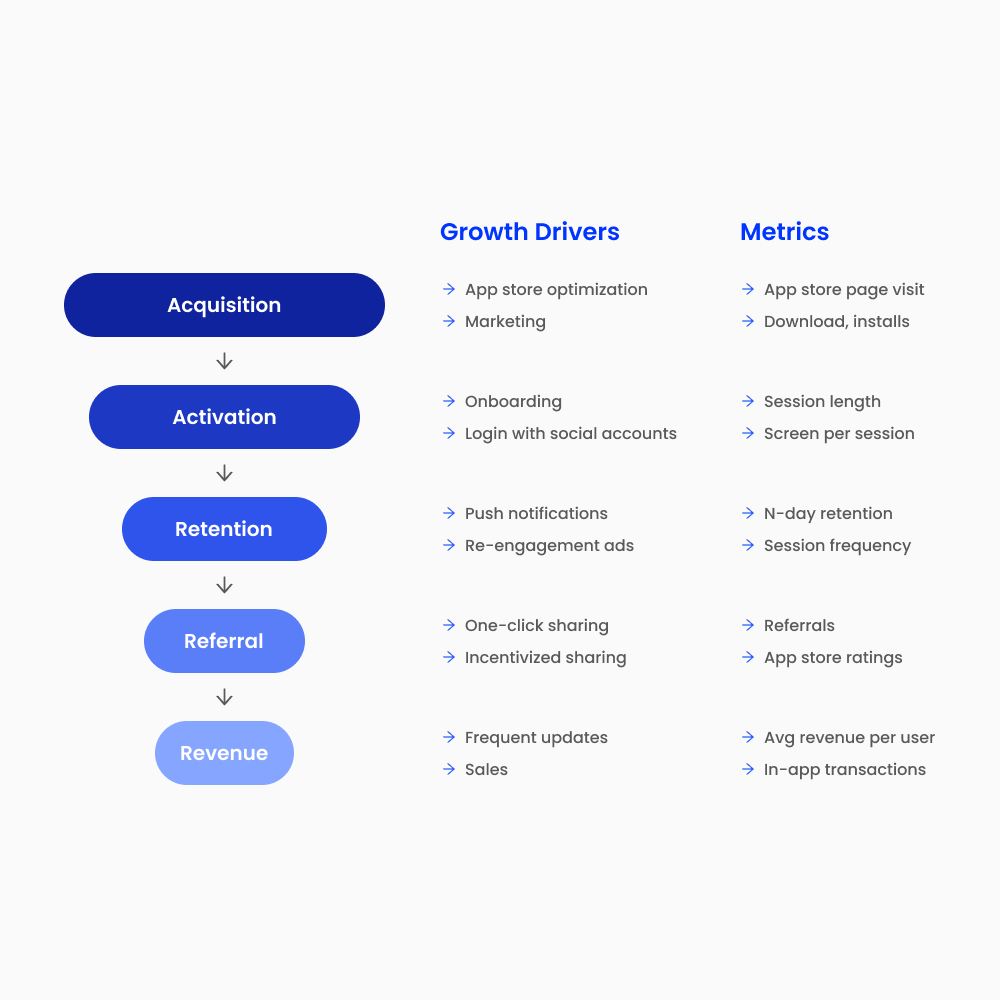
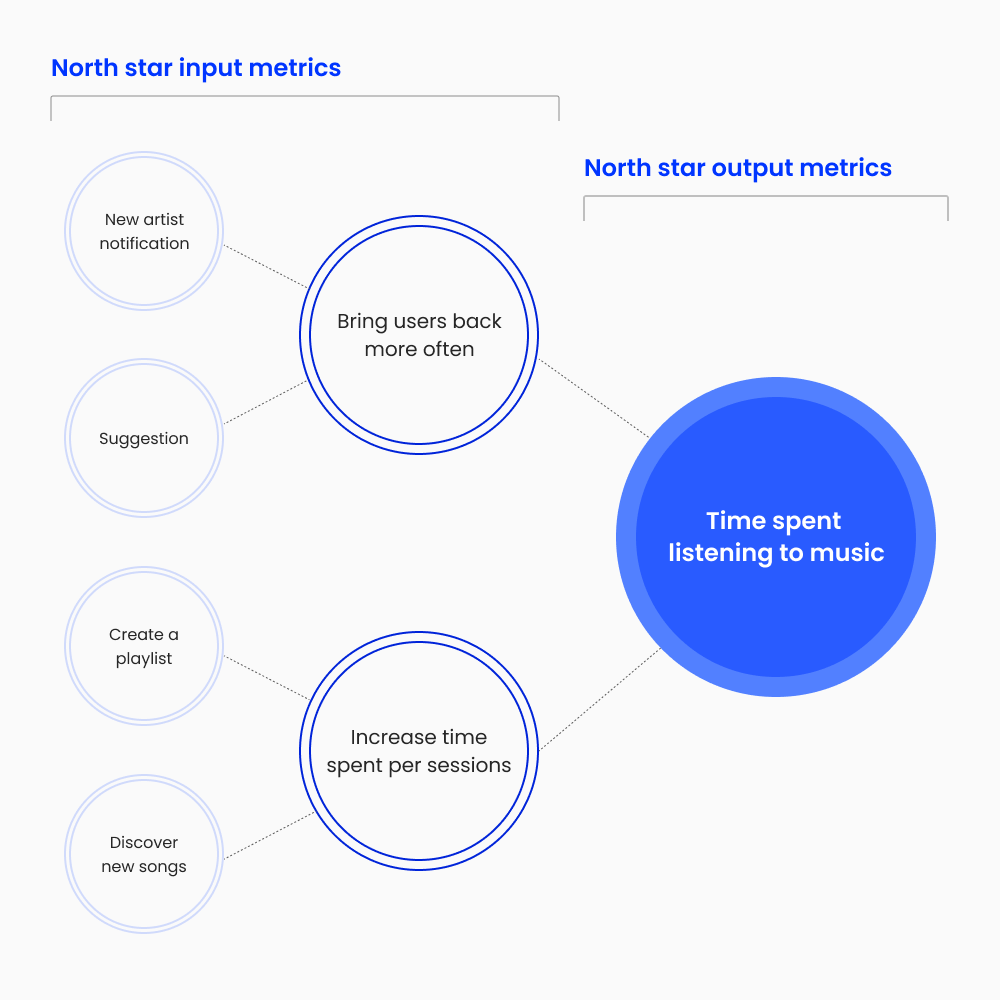
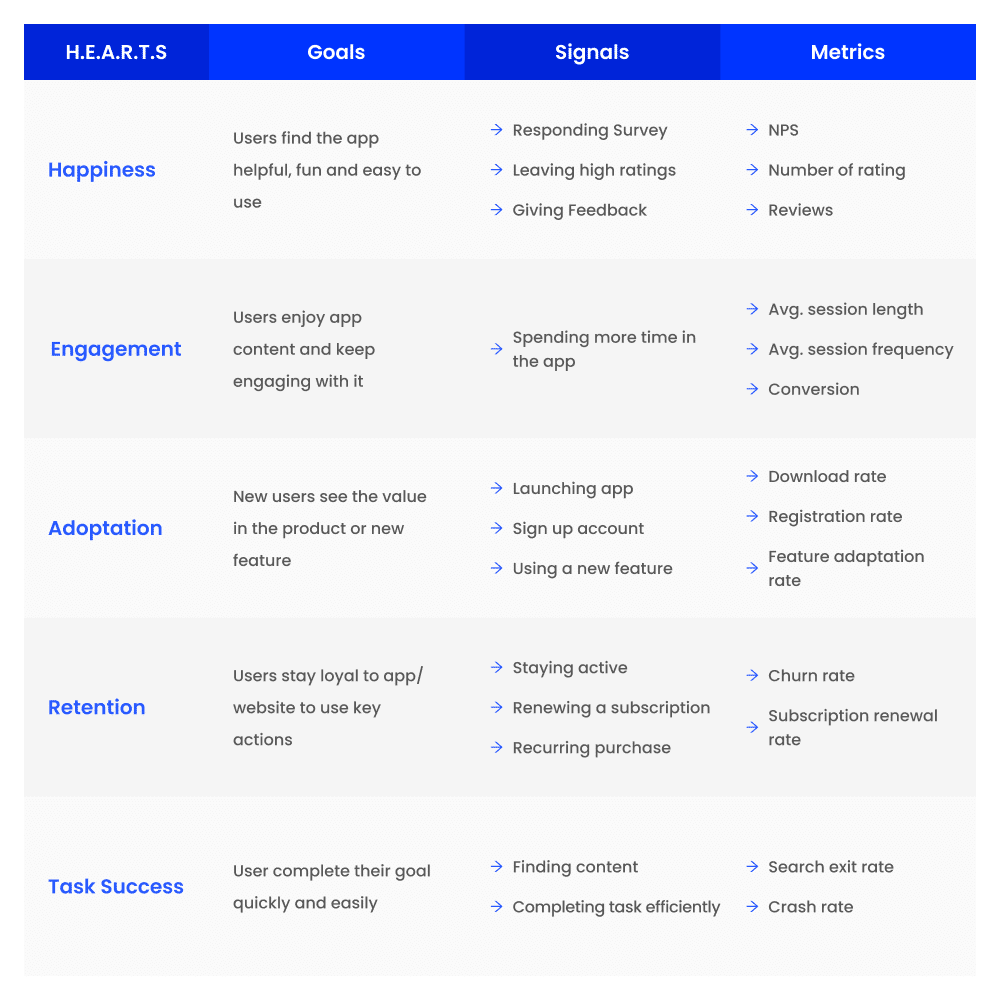
Product teams might use one of these frameworks or combine them into something unique. The most known frameworks are; North Star, HEART, AARRR, and GQM. The basis of all frameworks is to place the values that are tracked into a certain hierarchy. Northstar starts with a single goal and continues with sub-goals and metrics. HEART and AARRR collect goals into thematic groups and divide them into sub-breakdowns. GQM follows a simple goal-question-metric hierarchy independent of thematic groups.
What is a product design hypothesis?
The measurable and theoretical solutions to a user need
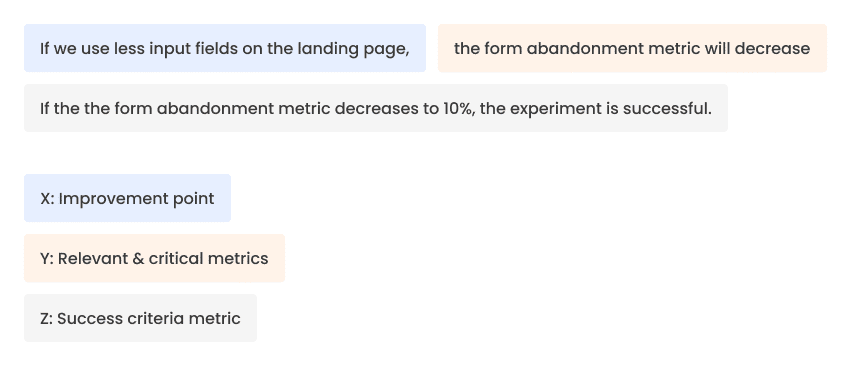
The product design hypothesis is a measurable and theoretical solution to a user’s need. Writing a design hypothesis that is based on objective criteria can be structured as X – Y – Z. There are lots of different structures to create a design hypothesis, but I like this one for effectively using metrics.
X is the improvement point for design, and Y is the relevant and critical metric that we will monitor. Z is the metric to measure success.
In order to understand that we are successful, the result must be at least Y = Z.
To give a more concrete and visual example;
A design hypothesis might emerge from a framework or several pieces of evidence collected from product analyzes. A hypothesis assists you to replace untested assumptions or educated guesses with more concrete proposals. It is not only gives us a profound understanding of how the product teams prioritize the features but also how it’s linked to the business goals as well as desired user actions.
This approach lays out a structured way to reinforce the product design process. Especially if you have a specific aim for how much of a certain feature to be used or what to fix first, utilizing product analytics helps product designers to work towards that agile mantra of failing fast and iterating until you succeed. As long as you validate, iterate and improve, you will eventually reach your goal.
Key Takeaways
It is hardly ever possible to create an amazing product by ignoring data or being totally data-driven. However, combining product analytics knowledge with qualitative feedback, such as user testing, feedback from users as well as colleagues, A/B testing, or any type of user research, will give you a more comprehensive perspective so that you can create the more useful product possible. Briefly, amazing products are the result of a combination of both qualitative and quantitative analysis.
As said before, in the end, design is about making intentional decisions, and incorporating metrics in a data-informed manner can be a valuable input to guide those decisions. At Dataroid we work in a collaborative manner to incorporate the different disciplines in the design process and use the power of metrics as much as possible and analytics platforms like Dataroid helps you reach the metrics you need.
Sign up to drive your business with the power of data
Senior Product Designer
YOU MAY ALSO LIKE

Drive your digital growth
Schedule a demo today to learn more on how we can help you unleash the potential of digital using Dataroid.